|
Introduction
One of most important devices used in demography is
life table (15). From various literature on mortality
investigation and other allied topics it is being found
that probably the first rudimentary life table was prepared
by a Roman author, Ulpian sometime during the third
century (9).
The life table provides a convenient, comprehensive
and self-contained summary of mortality conditions prevailing
in an actual or hypothetical population(2). A life table
combines the mortality experience of a population at
different ages into a single statistical model, and
describes the life history of that hypothetical population.
The relations among its columns and parameters have
formed one of the most fruitful traditions of mathematical
population research. The actuaries, demographers, public
health workers and many others use
this statistical device in studies of longevity, fertility,
migration, and population growth (21). The method of
life table is applicable to the analysis of not only
mortality but of many measurable processes involving
attrition or accession to aggregate size(12).
Of all the summary measures
that can be derived from a life table, the expectation
of life (or life expectancy) is perhaps the most well-known,
widely-used, widely-cited and widely-studied statistic.
For any age x
(most frequently, at age zero or birth) ex reports the
mean number of person-years of each person at age x
can expect to live, given the mortality rates observed
throughout the entire life Table2.
It gives the cumulative effect of mortality over
the remaining life span.
Life expectancy at birth is the most preferred indicator in demographic and health
analysis.
is the most preferred indicator in demographic and health
analysis.
As mortality rates decline, life expectancy increases,
thus a relationship exists with the change in mortality
schedule. There is a complex relationship between actual
mortality changes at various age groups and resulting
change in life expectancy. This idea was first brought
under consideration by Arriaga (1982). He introduced
the notion of temporary life expectancy, an index to
measure by each age group, the annual relative change
in the years to be lived. The gain in expectation of
life at birth 
is attributable to the effects of mortality improvements.
Arriaga (1984) Vaupel (1986), Pollard (1988), has given
rise to analysis of the ,
that shows how the progress in the mortality schedule
would
translate into progress in expectation of life at birth(28).
While analysing changes in life expectancy at
birth or studying differences in life expectancy between
two populations, decomposition of a difference
may identify ages at which the difference originates
in mortality or ages at which the differences occur.
Different phases of life, namely- infancy, childhood,
working life, reproductive life, and elder age are normally
adopted in life table concept. This division of life
phases help in understanding variations in the age patterns
and also facilitates comparison of different reasons
for mortality. The level of mortality in these phases
of life is measured by temporary life expectancy(10).
But temporary life expectancy (TLE) gives only increase
or decrease of years of life between particular ages
in different time periods without considering the maximum
possible reduction in those ages. Therefore, the pace
of mortality change during a period of time is treated
in relative measures by referring it with the maximum
possible change (Arriaga,1984). In this case, the index
of Annual Relative Change (ARC) in TLE can be used as
a better indicator. Annual Relative Change (ARC), an
index of TLE represents the difference in percentage
change between two mortality measures in their observed
reduction in deaths in relation to the total possible
reduction (Arriaga, 1984). In other words, it shows
the change in TLE between two periods.
It is seen that, life expectancy at birth for the world
population has undergone a significant change from 48
years in '1950- 1955' to 68 years in '2010' according
to estimates presented in United Nations (UN Population
Prospects, 2010 revision). According to Sample Registration
System (SRS) based abridged life table, there has been
a significant improvement in life expectancy in India
resulting in greater longevity. The life expectancy
at birth in India has increased from 50.5 years in 1970-75
to 64.6 years in 2006-10 for males and from 49.0 years
in 1970-75 to 67.7 years for females during 2006-10.
Whereas in Assam, life expectancy at birth has increased
from 52.9 years in 1986-90 to 61 years for males and
from life expectancy of 53.6 years in 1986-90 to 63.2
years for females in 2006-10. There is evidence of convergence
in mortality decline across the states in India.
Guwahati, the head quarter of Kamrup Metropolitan District
and the capital of state Assam of India is a fast growing
metropolis with a population of 9.69 Lakhs (Census report,
2011). The city is far the largest and fastest growing
commercial, industrial, educational settlement in the
North-Eastern region of India. Geographically, it is
located in the southern bank of the River Brahmaputra
between 26º 05' to 26º 15' N Latitude and
91º 35' to 91 º 55' E Longitude. The decadal
population growth rate in Guwahati Metropolitan Area
between 1981-91, 1991-2001 and 2001-2011 are 117.27,
38.6 and 26.3 respectively(Census, India). The recent
decadal growth rate (2001-2011) of Guwahati city of
26.3 % is higher than the national population growth
rate of 17.64%. The municipal limit of the city is 651.12
sq. Km in 2011. The population density of the city has
been 2558, 2705, 3741 and 4445 persons per sq.km in
1981, 1991, 2001 and 2011 respectively. Among all other
cities in the state, Guwahati is the largest urban centre
in Assam with 23.89% of the total urban population of
the state and it alone contributes 55% of the combined
population of the significant towns within the state
(Various issues of the Census, India). This city is
now become one of the prime places for Business, Government
as well as non Government offices, Educational Institutions,
and Health care services in North- East of India.
With increase of number of government, semi government
establishments, big to small private business establishments,
household units, vehicles during the last 25 years (1986-2011)
Guwahati is growing fast and thus making a deficiency
of housing. Rural and other migrants have been crowded
together in different areas. A rapidly urbanizing city
Guwahati leads a well comfortable life for a large section
of the people and in contrast, critical lives in slum
areas clouded by polluted and unhygienic conditions.
City's drainage system is poor in many areas. These
polluted conditions may affect the mortality situation
of the city dwellers. All these have tempted us to study
the mortality situation of the city in the last 25 years.
In this paper, it is attempted to study the changes
in the trend and differential of mortality of Guwahati
city by means of life table for males and females for
the period 1986 to 2011.
Objectives
(i) To study the trend and differential of probability
of death and expectation of life at birth and at some
selected ages by means of life table for the years 1986,
1991, 1996, 2001, 2006 and 2011 for males and females
in Guwahati.
(ii) To study the trend and differential of temporary
expectation of life (TLE) and annual relative change
(ARC) in TLE at different age group (0,5), (5,15), (15,
50), (15,60) and 60 and above for both sexes for the
above mentioned years in Guwahati city.
(iii) To study the age decomposition analysis in life
expectancies at birth for the above mentioned years
in Guwahati city for males and females.
Data
Data for this study has been extracted from the Birth
and Death Registration, Office of the Guwahati Municipal
Corporation (GMC) for the years 1986, 1991, 1996, 2001,
2006 and 2011. From large registered data on death in
Guwahati since 1986 to 2011, we limit our analysis to
a specific year considering every 5 year interval starting
from 1986 to 2011. We believe that selection of the
years at 5 year intervals will give us possible information
about trend and differentials prevailing in death statistics
over 25 years.
In this city, deaths are usually registered with specified
cause of death certified by medical practitioner. Deaths
occurring at health institutions are certified by physicians
as many of them are preceded by an illness and attended
by medical practitioner and deaths that occur at home
or at any other place are reported by their relative
to the authority. Further when a person dies his or
her body is brought to the cremation ground and the
person employed by Guwahati Municipal Corporation (GMC)
registers the name, age, sex, address, cause of death
and sends that to the higher concerned authority (4).
Even when a particular case, cause of death is not known,
the medical registrars are able to give the best information
on the cause leading to the death after probing from
the Post mortem reports.
There were a total of 24,145 deaths in Guwahati Metropolitan
city under consideration of every five year interval
since 1986 to 2011. The population age and sex structure
of Guwahati city is derived from census of India (1991,
2001 and 2011) and the next consecutive years' population
are estimated by taking the census population figures.
Method of constructing life
table
For construction of life table Greville's
method was used. Certain relationships among the functions
of life table have been made based on observed relationship
between the probability of death (nqx)
and the age specific death rates (nMx), between age
x to x+n.
The function (nqx)
is calculated by,
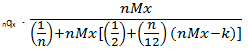
nMx
is the observed age specific death rate. k is constant,
obtained on the assumption that nMx values follow an
exponential curve. Here, K = 0.09.
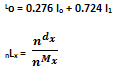
qx value for age group 0-1 is
calculated by,

The values
of ndx are
calculated on multiplying nqx
by lx. We start with taking lo
as 1,00,000. To obtain Ix+n we
subtract from Ix the corresponding
value of ndx
and the process is repeated.
The values of nLx
are obtained by -
The values of Tx and
are obtained
as

and, 
Temporary Expectation of
Life (TLE)
The Temporary Life Expectancy (TLE) is the average number
of years lived between the ages of x and x + n by a
group of lx members, all aged x. It is a good indicator
to understand the mortality reduction. TLE can be calculated
for various age spans of life defined by

where
lx is the radix of the life table,
Tx and Tx+n
are the numbers of person-years lived after ages x and
x+n,
Index of Annual Relative Changes (ARC) in TLE
Change in TLE between two periods or the pace of mortality
change during the period of time can be treated in relative
measure by referring it with the possible maximum change
(Arriaga, 1984). The index of Annual Relative Change
(ARC) serves as a good indicator to observe the maximum
mortality changes,
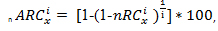
i is the width of the study years and  is the observed change in TLE
in relation to the maximum possible changes in age intervals
x to x+n.
Where, 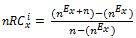 (Arriaga,1984) (Arriaga,1984)
Decomposing a Difference in Life Expectancies
Mathematically, decomposing a difference in life expectancies
is defined as
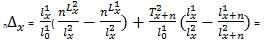 Contribution
of mortality difference in age group x to x+n to difference
in life expectancy at birth. Contribution
of mortality difference in age group x to x+n to difference
in life expectancy at birth.
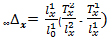 =
Contribution of mortality difference in open ended age
group to difference in life expectancy at birth. =
Contribution of mortality difference in open ended age
group to difference in life expectancy at birth.
Total life expectancy
difference 
Results and discussion
Comparison of calculated values of expectation of life
at birth ( for Guwahati with urban, Assam estimates
by SRS based Abridged Life table(India), 1986-2011.
In Table 1 a comparison is made between the values of
expectation of life at birth for Guwahati city obtained
by us and estimated by SRS (India) for urban, Assam
for different periods viz 1986-90, 1989-93, 1994-98,
1999-2003, 2004-2008 and 2006-2010. Life tables are
available for its major states of India and the country
by rural and urban areas, by sex for period of every
five years prepared by Census of India based on SRS
data. There is a good concordance between the two sources.
Table 1: Life Expectancy at Birth for male and female,
Guwahati, since 1986 to 2011 calculated by us and estimated
by SRS of India for urban, Assam
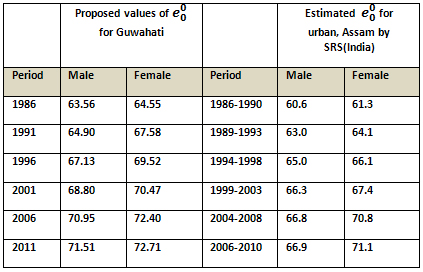
It is seen from the table that values of
for Guwahati are higher than the values obtained by
SRS. This may be due to the fact that people of Guwahati
are more aware about their health problems where literacy
rate may contribute to this factor. An average male
population of Guwahati lives 7.95 years longer in 2011and
females live 8.16 years longer in 2011 compared to 25
years earlier.
In 2006-2010, the expectation
of life at birth among urban males was lowest in Assam
(66.9) in comparison to other states of India i.e, the
expectation of life at birth among males were longest
in Himachal Pradesh (72.6), Kerala (72.3), Jammu &
Kashmir (72.2), Maharashtra (69.6), West Bengal (69.6),
Punjab (69.1) and Tamil Nadu (69.0)(15).
When it came to urban females, Kerala (76.4) took the
top expectation of life at birth in 2006- 2010, followed
by Himachal Pradesh (75.7) , J&K (75.0), Punjab
(73.5), Maharashtra (73.2) and urban Assam was at the
bottom of the ladder with an average woman expected
to live till just 71.1 years. Higher expectation of
life at birth has been observed for females for all
the study years since 1986-2011. The coverage of mortality
conditions by Office of the Birth and Death registration
observed higher
for average population in the city than overall for
urban population of Assam by SRS for both males and
females. Though expectation of life at birth in Guwahati
city improving over the years it is still behind in
development of some aspects of mortality conditions
compared to other urban areas of India.
While observing growth of life expectancy at birth it
is seen that life expectancy has increased from 63.56
years to 71.51 years in 1986-2011 for males and from
64.55 to 72.71 years for females. Expectation of life
at birth has increased by 1.34 years and 3.03 years
for males and females respectively in the period 1986-1991
which became 0.56 years and 0.31 years for males and
females respectively in the recent period 2006-2011
in Guwahati. In the three years 2001, 2006 and 2011
respectively, the city witnessed increasing life expectancies
at birth from 68.8, 70.9 to 71.5 years respectively
for males and 70.5, 72.4, 72.7 years respectively for
females. Overall, for the population of Guwahati, expectation
of life has
shown an increasing trend
(Figure 1) with an increase of almost 8 years for males
and 8.2 years for females over the last quarter century
i.e, 1986-2011. The maximum increase of
(male) was observed as 2.22 years during 1991-1996 and
the corresponding value for females was observed as
3.03 years. Also as the values of increases
with time from 1986-2011 for both males and females,
it is observed that for
females is greater than those of males in all the years
(1986-2011). This may be because deaths are more prevalent
in males in the age group 15-50 due to their hard work
and consumption of alcohol, cigarettes etc.
Figure 1: Expectation of
life at birth for both male and female, Guwahati, 1986
to 2011

Table 2 : Life expectancy
at selected ages for male and female, Guwahati since
1986 to 2011
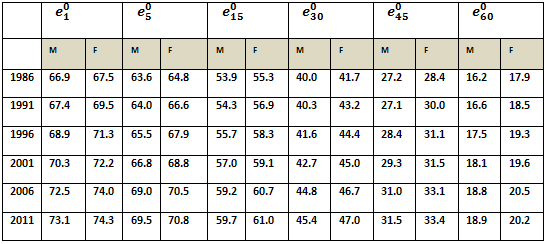
Table 2 recorded the expectation of life at selected
ages for male and female, Guwahati since 1986 to 2011.
It is observed that, in this period there had been remarkable
changes of expectation of life at all age groups. Twenty
five years back in 1986, the city had expectation of
life at age 30 as 40 (41.7) years for male (female),
at age 60 it was 16.2 (17.9) years for male (female)
which has now in 2011 become 45 (47) years at age 30
to almost 19 (20) years at age 60 for male (female)
respectively.
A joint look at the table 1 and 2 reveals that
is highest at age 1. This may be possibly due to higher
Infant Mortality Rate (IMR).
That is the city is yet to achieve a better IMR like
Kerala (Sarma and Choudhury, Canadian studies of population
2014). From 1986 to 2011 it has been observed that life
expectancy,
was higher for females than their male counterparts.
Highest value of
occurs at the age 1 and age 5 than all other age groups
for both male and female in most of the study years.
With the increase of ages, values of
decreased over the years under consideration. In the
year 1986, the minimum expectancy of life at age 60
was 16.2 years for males whereas for females it was
17.9 years. That is old age longevity is not satisfactory.
Variations of probabilities
of death (nqx) at selected ages, Guwahati, 1986-2011
Table 3 : Values of nqx, at selected ages for male and
female of Guwahati, since 1986 to 2011

In Table 3 results of probabilities
of death, nqx
for selected ages viz 0,1,15,30,45,60 since 1986 to
2011 for male and female in Guwahati city are depicted.
It is seen from the result that, probability of death
at infancy i.e. 0-1 age group is higher than all the
age groups except 60 years for both sexes in all the
study years. This says the gravity of the situation.
Even the death of children in 1-5 years of age is also
high. High death in infancy to children under 5 years
occurs due to malnutrition, prevalence of infectious
diseases, acute respiratory diseases, sanitation, acute
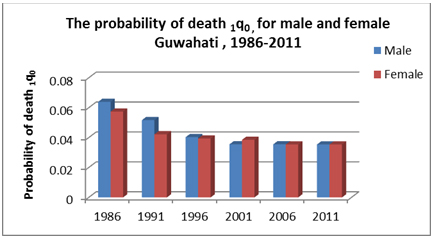
diarrhoeal diseases etc(13). While comparing the probabilities
of mortality for male and female we found that probabilities
of dying 1q0
for male in Guwahati had higher values than their female
counterparts in almost all study years since 1986 to
2011 except in 200. During 1986-2001 probabilities of
dying of female children at age under 5 years were found
higher than male but, in recent years 2006-2011 under
5 years male children showed lower survival. Apart from
this from the analysis it is observed that values of
5q30 for
females were higher than their male counterparts in
all of the study years , but the reverse was observed
in 5q45
and 5q60
that is, male probability of death was higher in these
age groups of (45-60). Females below 40 years of age
may have higher death probability due to complications
of pregnancy and any other maternal causes during this
period of their life. The age group (15-30) belongs
to a vulnerable special risk period for females. The
risk is due to pregnancy and child bearing or deaths
due to complications of pregnancy and child birth during
these ages. Thus, reduction of mortality of females
in this age group has been an area of concern. High
mortality of females may be a reflection of low social,
cultural as well as low health status of women in India.
Negligence of health care, less care during their reproductive
age period, malnutrition, and stress in all aspect of
life may be some causes(17). This states the gravity
of the situation. Even if a steep decrease of infant
mortality resumes in future, importance of female adult-age
mortality and health for the female population of Guwahati
city with other parts of the country will have to be
improved. Higher probability of death in the age group
15-30 for females may also occur due to the deaths of
illiterate females during their pregnancy and child
bearing period, specifically in slum areas. Thus female
education needs to be improved, also concern needed
for nutrition, increase of health services during pregnancy,
at the time of delivery, successful implementation of
the expanded programmes on immunization, diarrhoeal
disease, acute respiratory disease control programmes
as well as the control of the other infectious diseases
may also contribute to lower the infant mortality(13).
Decreasing trend for values of 1q0
has been observed (see Figure 2). It shows that the
values of 1q0
give a declining trend since 1986 to 1996 for both
males and females in Guwahati city. After that the values
of 1q0
have been stagnant. This may be because mortality has
not changed since 1996.
Figure 2: The probability of
death 1q0
, for male and female Guwahati during 1986-2011
The Temporary Expectation of Life (TLE)
The Temporary Expectation of Life (TLE), under mortality
conditions of Guwahati city for male and female along
with Annual Relative Change during 1986-2011 is depicted
in Table 4. It is observed that high variations in pace
of improvements in TLE and ARC existed across the study
years, for the age groups, irrespective
of sex. Maximum annual relative change (ARC) has been
observed during 1986 to 1991 for male in TLE 5E0,
whereas for female ARC was maximum during 1991 to 1996
in TLE 10E5.
Children below 10 years of age have higher values of
ARC compared to Adults and elderly age group irrespective
of sex. The relative changes in mortality were considerably
low even negative in some of the age group during 1986-
1991, 1996-2001 for male and during 1996-2001, 2001-2006
and 2006-2011 for female. Mostly, smaller changes of
ARC have been lower from elderly age group 60+ years
to adult age group for both male and female in almost
all the study years. This may be due to the fact that
adults as well as the elderly persons belong to high
risk exposure age group. Therefore low pace of change
of fatality reduction has been observed since adulthood
for both male and female.
It is observed from Table 4 that, the values of 5E0
for male and female are almost the same in recent years
like 2011, though it showed slight higher values for
female in previous study years viz 1986, 1991 ,1996
and 2006 respectively, then in 2001 male showed higher
5E0 value.
This has been depicted in Figure 3. It is seen that,
the trend of temporary expectations over the last 25
years is having a wide variation in the age group (5-15)
and (15-60) years (see figure 3). The TLE 10E5
for male, trend is smoothly increasing over the study
years. It is interesting to notice that, for the total
population female is in a more advantageous position
than males with the only exception in age group (5-15)
years.
Table 4: Temporary Expectation of life and Annual
Relative Changes since 1986-2011, Guwahati city

For female 10E5,
the trend shows increasing trend with higher values
than their male counterpart, came down slightly from
2006 onwards. For the age group (15-60) i.e. for working
age group male and female has wide variation since last
25 years. The TLE 45E15
for males in 2001 had less value than females, but it
became higher in 2011. For elderly persons female has
been having increasingly higher values of E60+
than male counterparts though in recent 2011 both male
and female has almost the same TLE values. Kerala's
outstanding performance in terms of TLE was observed
as this state experienced lower level of child mortality,
adult mortality(25).
Higher values of TLE for female are also common in other
major places of India like Kerala(24). The study shows
higher values of the index of Annual Relative Change
(ARC) in early age for both male and female, gives low
values in (15-60) and 60+ ages over the years. We observed
smaller changes in ARC during (1996-2001) to (2006 to
2011) for age group (5-15) & (15-60). High exposure
of ill health may lead to low ARC of mortality by adults
and elderly in Guwahat.
Figure 3: Temporary Expectations of life for male
and female, Guwahati for different span of life since
1986-2011
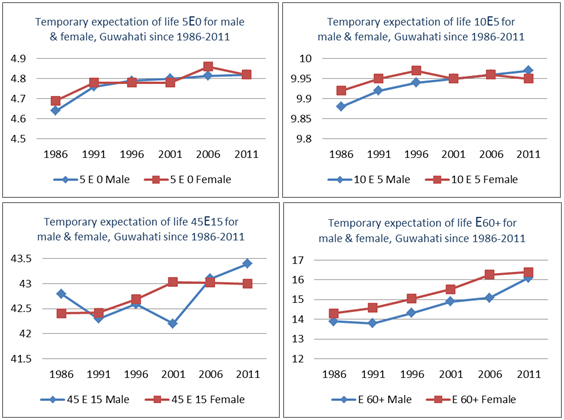
Table 5: Percentage of ratios of TLE to max possible
years in each phase of life of Guwahati, 1986-2011

The values of percentage of the
ratio of TLE at various age groups (Table 5) e.g. children
of (0-5) years, children and adolescent of (5-15) years
, male and female of (15-50) years and (15-60) years
age group oscillate mostly around 95% and 96% over the
years under consideration in a city like Guwahati. After
1986 the ratio of TLE of (0-5) has been showing an increasing
trend for both male and female (see Figure 4.i). The
same picture of increasing trend is being observed for
(5-15), (15-50) and even for age of 60 years above.
From table 5, it is observed that as time passes the
value of a particular nEx
increases. For example the percentage values for the
age group 0-5 for male(female) in 2011 was 96.4(96.4).
In 1986 this value for male(female) was 92.8(93.8).
The highest value of 5E0
is not satisfactory because in the city like Guwahati
one expects this value to be 100. Percentage values
in the age group 5-15 are almost satisfactory because
for this age group values are approximately equal to
100, indicating that in the adolescent period mortality
is negligible in the city.
For the age range 15-50, the percentage values are not
satisfactory for males and female. From 1996 to 2011
these values are slightly higher for females. This may
be due to the death of females during reproductive and
child bearing period for malnutrition. Literature from
many countries has shown that women in younger age less
than 20 and older than 35 years have higher mortality
rates(30). Female mortality in age group (15-50) also
increases with number of children they carry and birth
order (NFHS-3,2005-2006). 6% of teenage mothers aged
less 20 years contribute to high mortality of women.
The percentage values for males and females for the
age group 15-60 are also not satisfactory where for
female deaths in the early part of this age range have
already been stated and for males this may occur due
to hard work, consumption of alcohol, smoking, cigarette
etc. For the old age (60+) the percentage values are
far from being satisfactory. The highest value among
males and females is 41, not even half of maximum possible
value i.e, 100. However, in all study years for age
above 60 year higher values of ratio of TLE have been
seen for females than their male Counterparts (Figure
4.iii).
These values of ratios are expected to lie around 100
and state authorities should take necessary measures
to improve this situation in Guwahati to bring the percentage
of ratio of TLE for different spans of life to 100.
Figure 4(i) : Percentage
of ratios of TLE (0-5) to max possible years for male
and female , Guwahati, 1988-2011
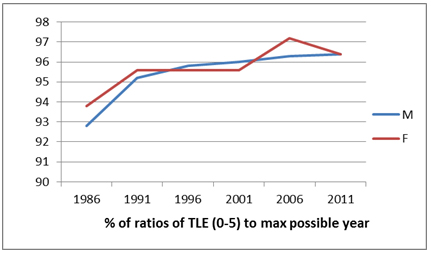
Figure 4(ii): Percentage of ratios of TLE (15-50) to
max possible year for male and female, Guwahati, 1988-2011

Figure 4(iii): Percentage of ratios of TLE 60+ years
to max possible year for male and female, Guwahati,
1986-2011
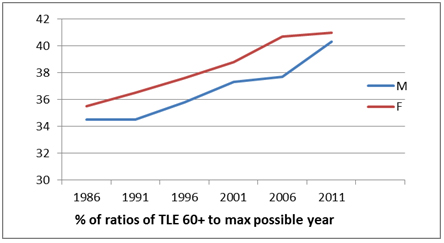
Table 6 : Age decomposition of differences in life expectancies
(LE) at birth between 1986 and 2011 for male and female
separately, Guwahati

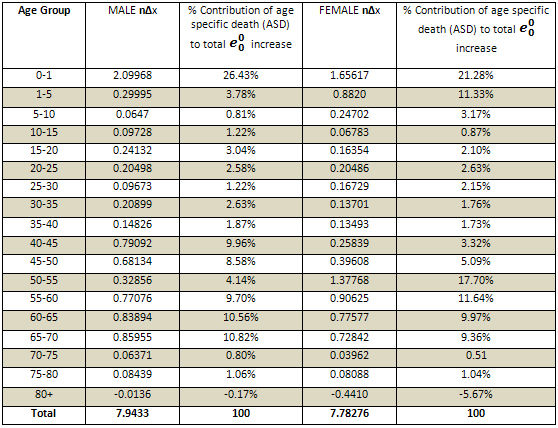

Figure 5
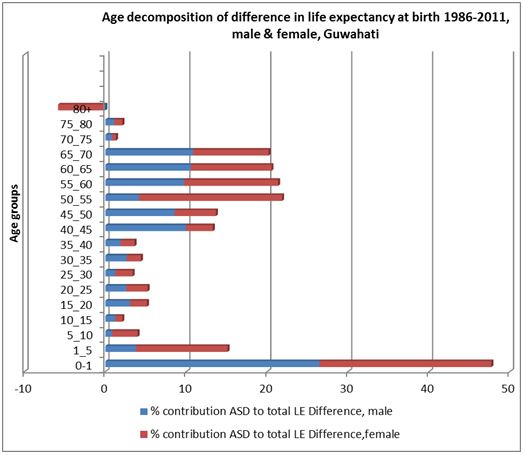
The decomposition analysis (Table 6) shows, the
contribution of different age groups in the increase
of life expectancy at birth for male and female. Early
childhood mortality i.e. infant mortality is a major
contributor to the total change of life expectancy as
compared to the higher age group in Guwahati for almost
all the age group between 1986-2011. It shows from decomposition
analysis that for the total
difference (male) as 7.94 early childhood mortality
has contribution of 26.43% in contrast to -0.17% at
age 80+ and for the total
difference (female) as 7.78, early childhood mortality
has contribution of 21.28% in contrast to -0.44% at
age of 80+. Overall the decomposition analysis here
produces positive and subsequently negative contribution
to the total changes or total differences in expectation
of life at birth in the city between 1986-2011. It is
the improvement in the process of survival of population
in Guwahati that contributes improvement in life expectancy.
It is seen from the above table
that there is gain in life expectancy in almost all
the age groups for both males and females (expect for
males in the age group 80-85 and 85+). At birth, the
life expectancy for males is 71.51 years according to
the life table, and for females it is 72.71 years. The
gain in life expectancy at birth may be due to the improvement
in mortality rates for the middle age group.
The objective of this study is to see the trend and
differential of mortality of Guwahati city by means
of life table. The strength of the study is 25 years
of prospectively collected data. Overall, expectation
of life at birth has undergone a significant change
from 1986 to 2011. Females have recorded accelerated
improvements in their life as compared to their male
counterparts over the last 25 years. The findings in
Guwahati have slight higher values than SRS, Assam urban
life table values in most of the study years.
The demonstration of comparative study of life tables
of Guwahati, an urban set up of North-East of India
since 1986-2011 may be of help to planners and implementers
of the State's health development programmes. With its
rich natural resources and high business and economic
activities, Guwahati is a major place of North-East
of India and it has to achieve the desired outcomes
of longevity of life. The issues of infants, children
and mothers as well as adults need more attention to
address the issues regarding overall gain in survival
of people in Guwahati city. Future progress should be
judged not only in terms of overall gain in life expectancy
but also in terms of healthy life of people. The national
programmes that are followed for prevention of communicable
and non communicable diseases should be sincerely carried
out to bring a change in overall longevity of life in
this area and it should be the goal which is within
our reach.
References
1. Brazilian Southeast region, (1980), "Percent
contribution to the gain in life expectancy at birth,
based on Arriaga and Pollard's method".
2. Carlson E (2006), "Ages of Origin and destination
for a difference in life expectancy",
3. Castro D.M.E (2000), "Changes in mortality and
life expectancy: Some Methodological issue", Office
of Population Research, Princeton University.
4. Choudhury L. and Rajbonshi R (2006), "A Study
Of Cause Specific Mortality For Persons at Ages 40 Years
and Above in Guwahati City: 1991 and 2001", Demography
India Vol.35, No 2
5. Choudhury L. and Biswas N. (2012), "Development
of Regression Equation and Estimation of Health Expectancy
for South Asian Region". Turkish Journal of Medical
Science.
5. Census of India (1991), "Social and Cultural
Tables for Assam". Ministry of Home Affairs, New
Delhi.
6. Census of India (2001), Social and Cultural Tables
for Assam. Ministry of Home Affairs, New Delhi
7. Census of India (2011), Provisional Population Totals
For Assam. Ministry of Home Affairs New Delhi.
8. Department of Economic and Social Affairs, Population
Division, New York (2012), "Changing Levels and
Trends in Mortality: The role of patterns of death by
cause", United Nations,
9. Frier B (1982), "Roman life Expectancy: Ulpian's
evidence", Harvard studies in Classical Philology,
Vol 86 (1982), 213-251.
10. Kohli K.L. (1997), Mortality in India, Sterling
Publishers Pvt. Ltd. New Delhi.
11. Lopez A.D., Solomon J, Ahmad O, Murray Ch, Mafat
D.(2000), "Life Tables for 191 countries, Data,
Methods and Results", WHO.
12. Namboodiri, K. And Suchindran, C.M (1987), "Life
Table Techniques and their Applications", Academic
Press, New Delhi.
13. Park K (2013), "Park's Textbook of Preventive
and Social Medicine, 21st Edition, Jabalpur, M/s Banarasidas
Bhanot Publishers, India.
14. Pollard J H. (1988) "On the decomposition of
changes in expectation of life and differentials in
life expectancy", 25, 2: 265-276.
15. Preston S.H, Heuveline P, and Guillot M. "Demography,
measuring and Modelling Population Processes",
Blackwell Publishers. New Delhi
16. Registrar General for India (1999, 2001, 2006, 2011),
"Sample Registration System Bulletins". Ministry
of Home Affairs, New Delhi.
17. Reid A.J (1990), "Maternal Mortality Preventing
the Tragedy in Developing Countries". CAN. FAM.
Physician Vol 36 January.
18. Sample Registration System based Abridged life Tables
(1990, 1995, 2000, 2005, 2010, 2012), Registrar General
for India.
19. Sarma R and Choudhury L (2013), "?mpact of
migration on net reproduction rate, and an assessment
of the speed of population growth in the presence of
migration, in the districts of ?erala and ?ssam (India),
Canadian Studies in Population, Vol 40, No. 3-4.
20. Singh A. and Ladusingh L. (2013), "Increasing
life expectancy and convergence of age at death in India".
GENUS, LXIX No.1, 83-99.
21. Shryock, H.S., Seigel, J.S. and Associates (1976),
"The Methods and Materials of Demography",
US Govt. Printing Office, Washington, DC.
22. Swanson, D.A and Seigel, J.S. (2004), "The
Methods and Materials of Demography", Second Edition,
Elsevier Inc. London.
23. Sanders B.S (1964), "Measuring Community Health
Levels", American journal of public health, 54
1063-1070.
24. Starrs A. (1987), "Preventing the tragedy of
Maternal Death. A report of International Safe Motherhood
Conference". Geneva.
25. Thomas M. B (2012), "Changes in Mortality in
Kerala, India: Some Emerging Concerns", Universal
Journal of Education and General Studies, Vol. 1(8),
pp 234-241.
26. United Nations Population Division, World Population
Prospects, (2010) revision, New York.
27. United Nations (1982), "Levels and Trends of
Mortality since 1950", 74, New York.
28. Vaupel J. W(1986), "How change in age specific
mortality affects life expectancy", Population
Studies, 40 : 147-157.
29. World Health Report (2005), World Health Organization
(WHO), Geneva.
30. World Health Report (2010), World Health Organization
(WHO), Geneva
31. WHO (1985), "Prevention of Maternal Mortality:
report of a WHO Inter-regional meeting". Geneva.
|